
Actuator in Spring Boot
0 CommentsLast Updated on October 15, 2024 by jt
Spring Boot Actuator is a sub-project of the Spring Boot Framework. It uses HTTP endpoints to expose operational information about any running application.
The main benefit of using this library is that we get health and monitoring metrics from production-ready applications. Moreover, the gathering of metrics, understanding traffic, or knowing the state of the database, becomes tremendously easy with Actuator.
In this post, you will learn how to use and configure Spring Boot Actuator.
Maven Dependency for Spring Boot Actuator
To use Actuator in your application, you need to enable the spring-boot-actuator dependency in pom.xml.
<dependency>
    <groupId>org.springframework.boot</groupId>
    <artifactId>spring-boot-starter-actuator</artifactId>
</dependency>
Example to Demonstrate Spring Boot Actuator
Spring Boot Actuator provides us with a list of available built-in endpoints which get enabled with the addition of the actuator dependency.
However, in the latest versions, only two endpoints are enabled by default, /health and /info.
To understand the various endpoints, let us create a REST Controller class.
This is the code of the DemoController class.
DemoController.java
package guru.springframework.controller;

import org.springframework.web.bind.annotation.GetMapping;
import org.springframework.web.bind.annotation.RestController;

@RestController
public class DemoController {
    @GetMapping("/get-info")
    public String getStringMessage() {
        return "Hi ! You will be able to monitor health of the application !!" ;
    }
}
The preceding code shows a Rest Controller class annotated with @RestController. This class contains a request handler method that returns a String message.
Build and Run the Application
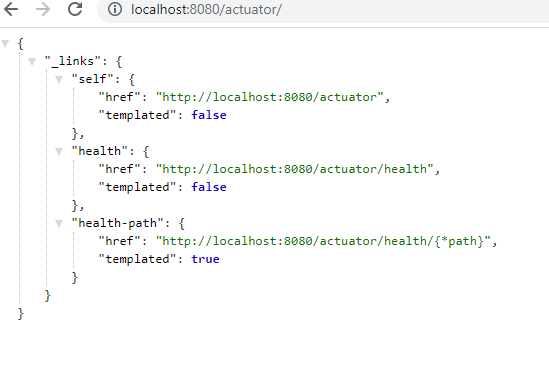
Run the main class of the application and open the browser to invoke the URL http://localhost:8080/actuator
This is the output that you will see in the browser. The output shows three endpoint URLs.
Let us access the default /health endpoint by pointing the browser to http://localhost:8080/health
The output is this.
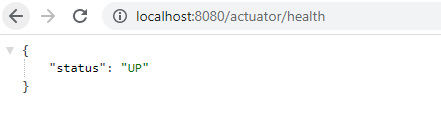
The above output denotes the status UP. It means the application is healthy and running without any interruption.
You can enable all of the built-in endpoints of Actuator. To do so, set the configuration in the application.properties file, like this.
management.endpoints.web.exposure.include=*.Open the browser and now access the http://localhost:8080/actuator URL.
You will get this output.
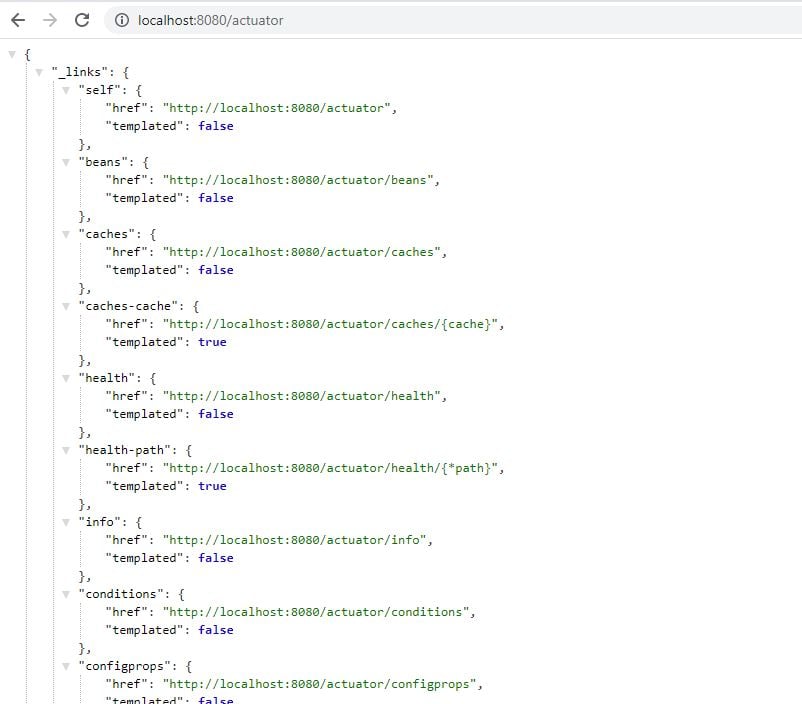
Notice that we now have a number of endpoints. Each of these endpoints has its own function. We can access each of these endpoints individually.
From the browser access the /env endpoint by pointing to http://localhost:8080/actuator/env
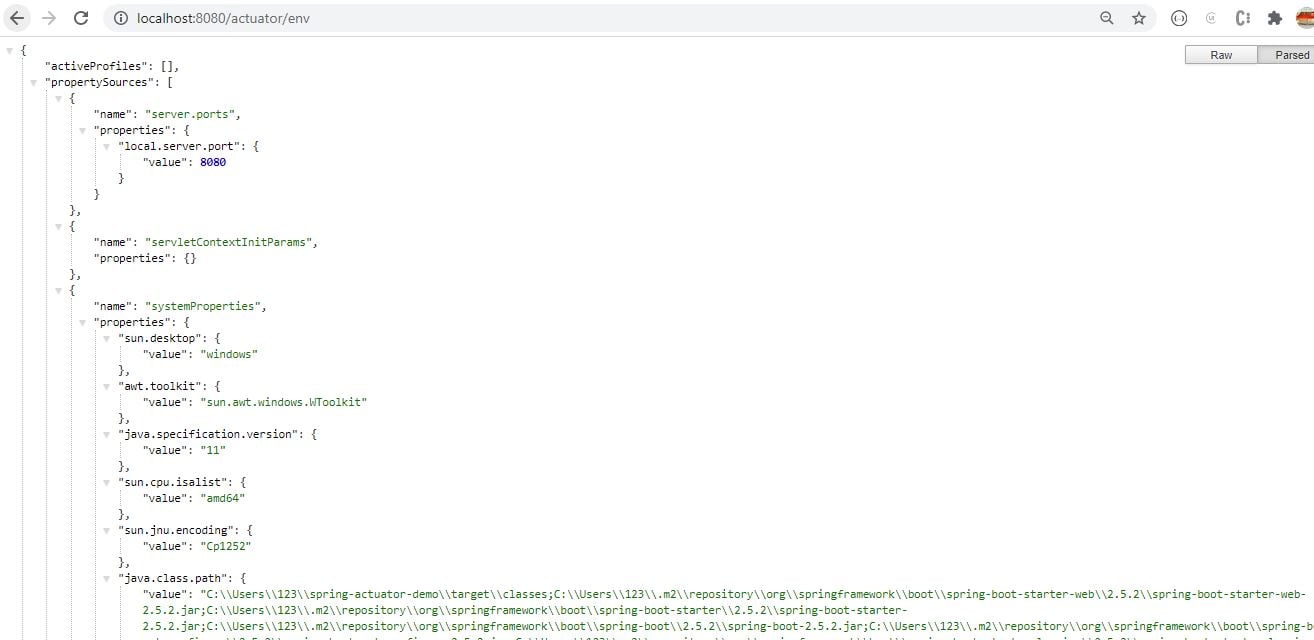
Notice that this endpoint provides information on the environmental configurations about the server, such as the Operating System, version, CPU type, encoding type, and so on.
Another endpoint that you can check is /metrics through the URL http://localhost:8080/actuator/metrics
This is how the output looks like.
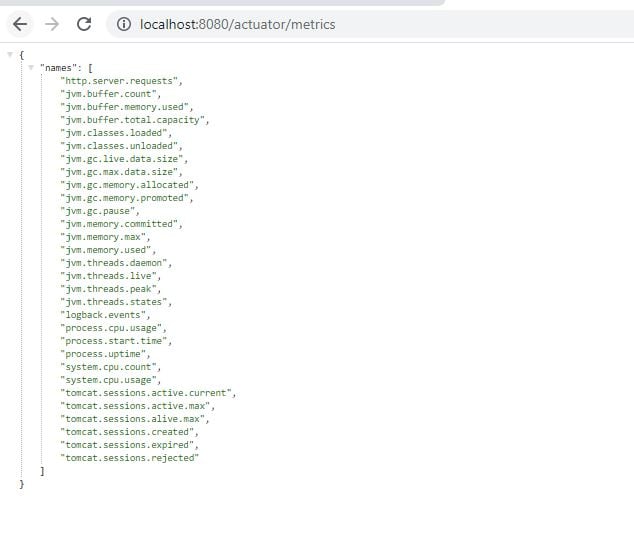
It lists down all the metrics that are available for you to track such as system.cpu.usage, jvm.memory.max and so on.
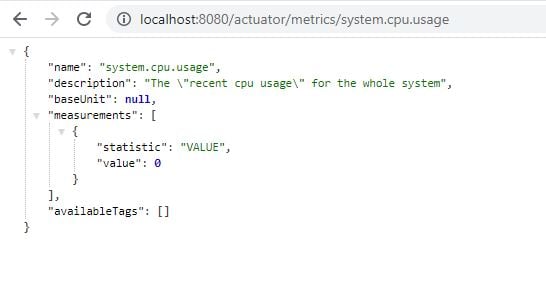
To get the details of an individual metric, you need to pass the metric name in the URL like this:
http://localhost:8080/actuator/metrics/{MetricName}
For Example, to get the details of system.cpu.usage metric, use the URL:
http://localhost:8080/actuator/metrics/system.cpu.usage
The Output for the above endpoint is this.
There are several other endpoints that you can check such as:
/actuator/auditevents: Exposes audit event information. Requires AuditEventRepositoryBean./actuator/beans:It displays a complete list of all the Spring beans in your application./actuator/mappings:This shows a collated list of all@RequestMappingpaths./actuator/caches:Exposes available caches./actuator/conditions:Shows the conditions that were evaluated on configuration and auto-configuration- /
actuator/configprops: Displays list of configuration properties. Subject to sanitization. - /
actuator/env:Exposes properties from String ConfigurableEnvironment. Subject to sanitization. /actuator/flyway:Shows Flyway database migrations applied./actuator/health:Shows application health information/actuator/httpexchanges:Displays HTTP exchange information (by default, the last 100 HTTP request-response exchanges). Requires an HttpExchangeRepository bean./actuator/info:Displays arbitrary application info./actuator/integrationgraph:Shows the Spring Integration graph. Requires a dependency onspring-integration-core./actuator/loggers:Lists down a list of all the configured loggers in your application with their corresponding log levels./actuator/liqubase:Shows any Liquibase database migrations that have been applied. Requires one or moreLiquibasebeans./actuator/metrics:Shows “metrics” information for the current application./actuator/mappings:Displays a collated list of all@RequestMappingpaths./actuator/quartz:Shows information about Quartz Scheduler jobs. Subject to sanitization./actuator/scheduledtasks:Displays the scheduled tasks in your application./actuator/sessions:Allows retrieval and deletion of user sessions from a Spring Session-backed session store./actuator/shutdown:Lets the application be gracefully shutdown. Only works when using jar packaging. Disabled by default./actuator/startup:Shows the startup steps data collected by theApplicationStartup. Requires theSpringApplicationto be configured with aBufferingApplicationStartup./actuator/threaddump:Performs a thread dump.
If your application is a web application (Spring MVC, Spring WebFlux, or Jersey), the following additional endpoints are available:
/actuator/heapdump:Allows retrieval and deletion of user sessions from a Spring Session-backed session store./actuator/logfile:Returns the contents of the logfile (if thelogging.file.nameor thelogging.file.pathproperty has been set). Supports the use of the HTTPRangeheader to retrieve part of the log file’s content./actuator/prometheus:Exposes metrics in a format that can be scraped by a Prometheus server. Requires a dependency onmicrometer-registry-prometheus.
Spring Security with Spring Boot Actuator
If you have Spring Security enabled for your application, all endpoints are secured by default. If you wish to expose the Spring Boot Actuator endpoints, add the following configuration for Spring Security.
Spring Security with Spring MVC
@Bean
    @Order(1)
    public SecurityFilterChain actuatorSecurityFilterChain(HttpSecurity http) throws Exception {
        http.securityMatcher(EndpointRequest.toAnyEndpoint())
                .authorizeHttpRequests(authorize -> authorize.anyRequest().permitAll());

        return http.build();
    }
Spring Security with WebFlux
    @Bean
    @Order(1)
    public SecurityWebFilterChain actuatorSecurityFilterChain(ServerHttpSecurity http) throws
               Exception {

        http.securityMatcher(EndpointRequest.toAnyEndpoint())
                .authorizeExchange(authorize -> authorize.anyExchange().permitAll());

        return http.build();
    }
Software Bill of Materials – SBOM
Spring Boot 3.3.0 comes equipped with native support for CycloneDX, simplifying the creation of SBOMs for your application. This is especially convenient for developers looking to automate software documentation without extensive manual setup. The SBOMs also all you to use automated security tools to scan your applications and alert you on security vulnerabilities.
To set up CyclenDX with Spring Boot you need to:
Use Spring Boot 3.3.0 or higher.
Add the following Maven plugin to your build:
<plugins>
  <plugin>
    <groupId>org.cyclonedx</groupId>
    <artifactId>cyclonedx-maven-plugin</artifactId>
  </plugin>
</plugins>
Expose the SBOM endpoint. Add the following to your application.properties file.
management.endpoints.web.exposure.include=health,sbomThe output from /actuator/sbom` will show the following:
HTTP/1.1 200
Content-Type: application/vnd.cyclonedx+json
Content-Length: 161738

{
  "bomFormat" : "CycloneDX",
  "specVersion" : "1.5",
  "serialNumber" : "urn:uuid:3842be09-b12e-45ed-8038-babb72a53750",
  "version" : 1,
For additional information, see the official SBOM support announcement here.
Summary
In this Spring Boot Actuator post, we saw a few endpoints with few easy configurations. There are advanced configuration options too like changing the Management endpoint context path. We can change the default context path from /actuator to something else. There is also a configuration option to customize the management server port.
You can find the source code of this post here on Github.