
Debug your Code in IntelliJ IDEA
0 CommentsLast Updated on April 26, 2020 by Simanta
Introduction
Programmers spend a great deal of time looking for errors in code. This process is called debugging and in this post, we will focus on how it is done in IntelliJ IDEA Java IDE.
After reading this tutorial you should be able to find errors in code with less effort, thanks to the use of IDEA built-in debugging features.
Setup
For this tutorial, the IDE we will use is the IntelliJ IDEA version 2020.1.
We will also use Java 11, Gradle in version 6.3, Lombok and Spring Boot 2.2.6.
Code
Example 1
Broken code
Let us start with this simple program:
public class DebugExampleOne {

    private static class Broken {
        private final int value = 1;
    }

    private Broken broken;

    void printValue() {
        System.out.println(broken.value);
    }
}
DebugExampleOne class will allow us to make a simple error which we can find using the IDEA debugging tool.
@SpringBootApplication
public class DebuggingIdeaApplication {

    public static void main(String[] args) {
        SpringApplication.run(DebuggingIdeaApplication.class, args);

        DebugExampleOne exampleOne = new DebugExampleOne();
        exampleOne.printValue();
    }

}
Above we have a standard Spring Boot main application class, where we initialize the object of DebugExampleOne class and use its printValue() method.
If you see an error already, good job! In more complicated code though it may not be so easy to find such errors, so let us see how IDEA can help us track this nasty little bug.
Error
When you run this program in IDEA (easiest way to do that is to open the main application class in the editor and press Ctrl + Shift + F10), you will see an error similar to that below:
Exception in thread "main" java.lang.NullPointerException
  at java.base/java.util.Objects.requireNonNull(Objects.java:221)
  at guru.springframework.debug.idea.DebugExampleOne.printValue(DebugExampleOne.java:12)
  at guru.springframework.debug.idea.DebuggingIdeaApplication.main(DebuggingIdeaApplication.java:13)
The first hint we already have here we see the error is in DebugExampleOne class, line 12. Let us see this then:
System.out.println(broken.value);
Looks like nothing unusual happens here. Let us then debug why we have an error here.
Debugging
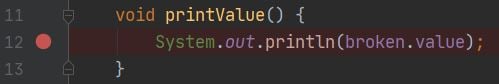
The first thing to do is to set up a breakpoint on that line to let debugger stop and give us a chance to investigate what is happening. To do that, we have to go to that line we want to stop debugger on, and click near line number (or press Ctrl + F8). As a result, we will see that line becomes colored in red and that red dot became visible near line number. This indicates we just set a breakpoint on this line.
To run a debugger you have to press Shift + F9. This shortcut will work only if you have run the project as described before. If you need help with that, see the IntelliJ documentation.
Once the debuggeer runs, you should be seeing something similar as below:
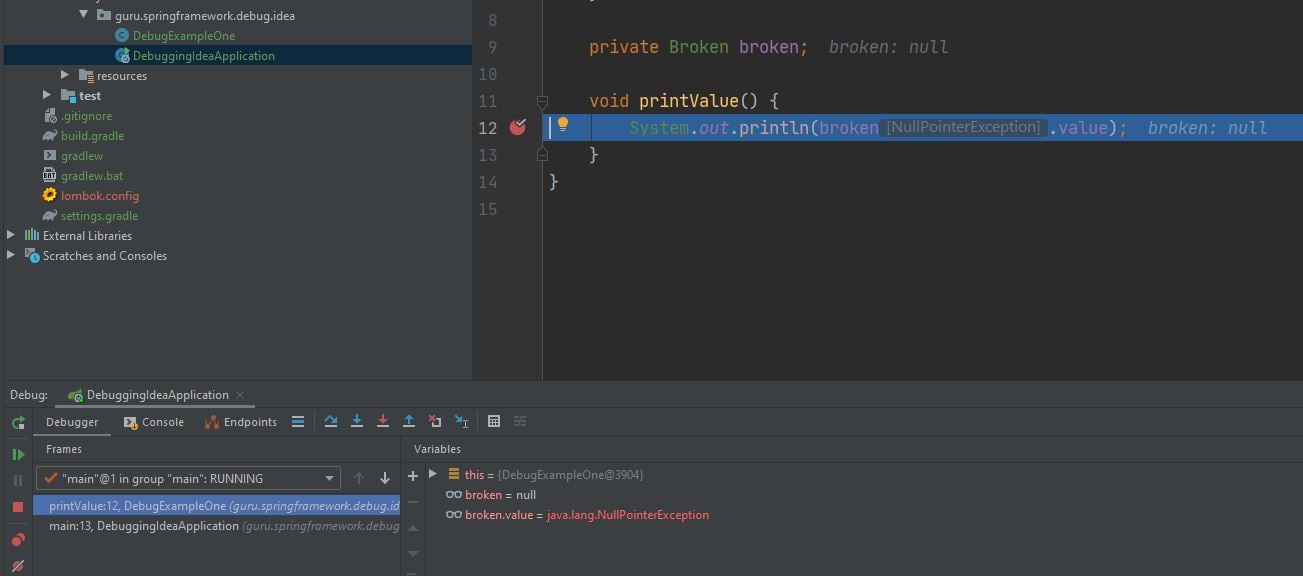
Now we may see that IDEA shows us a lot of useful information. First, we have a debugger panel at the bottom:
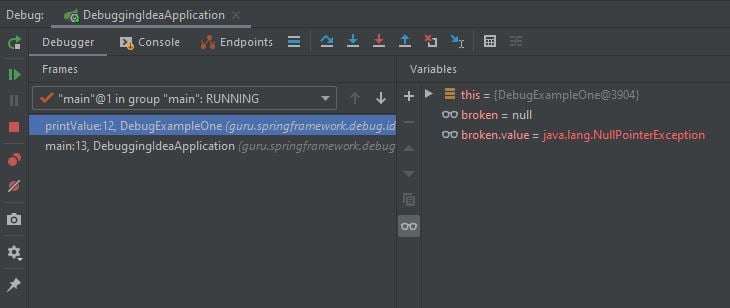
On the left side, we have a list of frames. Frames let us navigate the call stack, so we can easily see how we got to the point where we put the breakpoint we are currently at. You can also switch threads call stacks, using little drop down above.
On the right side, we have a list of watches. Watches are a list of variables or computed expressions that have values corresponding to the current place debugger is at. You can think of them as a snapshot of data in the application. More on that later.
We may also see some changes in the code editor window:
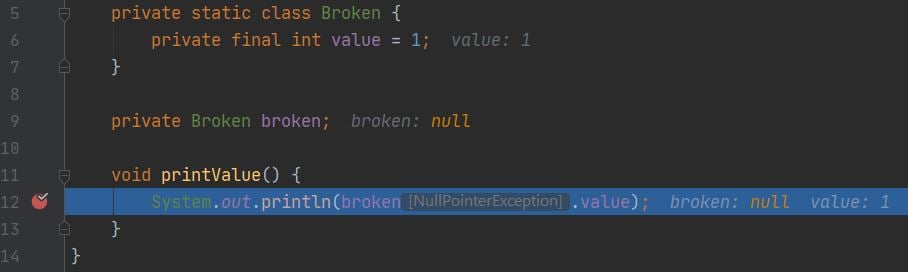
Near some lines, we may notice a grey text showing us the values of different variables and expressions.
Fix
All this information should be enough for us to solve this simple case. From watches panel, we see that broken.value throws NullPointerException. We can also see, that broken is null. If we compare that to what the editor shows, we see that it is almost the same information in both places, just with a bit different form. It is probably easy for us to see now, that broken object is null, so trying to get value field from it, by using broken.value in printValue() method will throw an NPE exception.
To fix that, we can just initialize broken, adding = new Broken(); on a field declaration. If we try to run debug our application after that:

Now we do not have any exception info or null values in watches or editor, so the program works just fine (you can confirm that by running an application without the debugger).
Example 2
Broken code
For a second example, let us use the same main application method with a different body:
@SpringBootApplication
public class DebuggingIdeaApplication {

    public static void main(String[] args) {
        SpringApplication.run(DebuggingIdeaApplication.class, args);

        ...

        DebugExampleTwo exampleTwo = new DebugExampleTwo();
        for (DebugExampleTwo.Container container : exampleTwo.getContainers()) {
            System.out.println("Container value -> " + container.getValue());
        }
    }

}
We will create a second broken example object and iterate over a list of its containers to print their values.
@Getter
public class DebugExampleTwo {

    @Getter
    public static class Container {
        private Integer value;
    }

    private List<Container> containers = new ArrayList<>(10);

    public DebugExampleTwo() {
        for (int i = 0; i < 10; i++) {
            if (i % 5 != 0) {
                Container container = new Container();
                container.value = i;

                containers.add(container);
            }
        }
    }
}
DebugExampleTwo class contains one field, which is a list of containers. Container is a wrapper class for a single Integer value. In DebugExampleTwo constructor, the list is filled with containers in a simple loop with a simple modulo condition. An error may be quite obvious here, but it will be enough to show some more debugging options in IDEA.
Error
As before, the first thing we will do is to run the program. The output is:
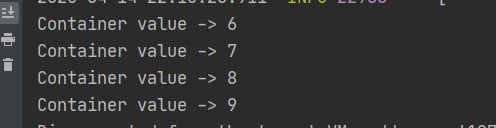
Container value -> 1
Container value -> 2
Container value -> 3
Container value -> 4
Container value -> 6
Container value -> 7
Container value -> 8
Container value -> 9
Not good. We should have 10 lines, where we have only 8. Containers with values of 0 and 5 are missing. There is no obvious error like in the previous example, this time we have a logic error. Let us find it!
Debugging
This time, as we do not have a clear indication of where the error may be. There is nothing that points to any line, where the error is. So, we will start from the point where we call our broken code:
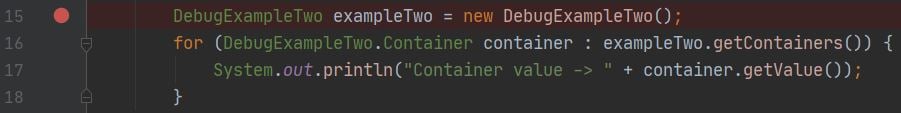
After starting debugging run we stop in this place. There is nothing in watches (as there are no variables) and everything seems fine. We want to see how code works more thoroughly. For this purpose, we will use debugger stepping.
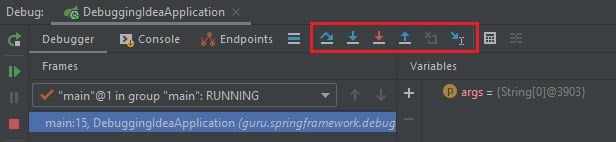
We have several icons here, describing from the left:
- Step over (F8) – goes over the line, skipping internals of the code it skipped (for example, stepping over the method call, will not move debugger into that method)
- Step into (F7) – moves debugger into the internals of code currently on debug point (for example, if we are stopped on a method call, it will move into that method body)
- Force step into (Alt +Shift + F7) – useful if sometimes method call is skipped with normal Step into, forcing it inside
- Step out (Shift + F8) – it goes out of the current method into the caller code
- Drop frame – allows us to drop the last stack call, and go back to the previous one
- Run to cursor (Alt + F9) – continues execution until the caret position is reached
As we want to see what happens in DebugExampleTwo constructor, we will use Step into. After that, we will land in the constructor. As there is not much more we can really go into here, we will use Step over. If we try several such step overs, we can observe, that we do not go into condition when the value of i is 0 or 5.
Fix
The fix should be obvious right now – if we want to have all container values, we just have to remove the condition.
More tools
Advanced breakpoint
Example two was quite simple and trivial. Yet, we will stick with it some more because it will allow us to learn some more interesting debugging techniques.
For example, let us assume, that something wrong happens only for a ninth element in the list. It will be hard to make a fix and skip debugging all the way until we reach the desired point in the ninth loop round, just to see that it was a bad fix. There is a way to solve that.
If we put a breakpoint inside the loop and click that small red dot near line number using a right mouse button, we will open advanced breakpoint options:
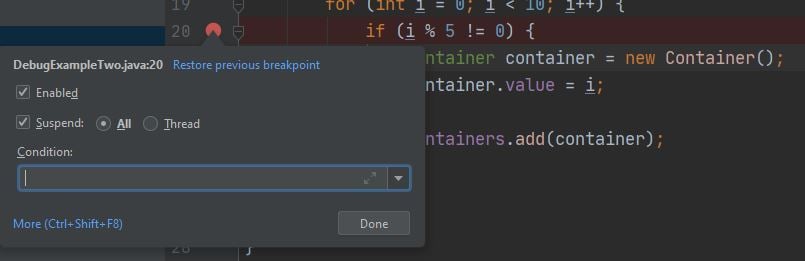
Here we have a “condition” field, where we can insert, for example, i == 9. Thanks to that, when we run the debugger, it will stop on this breakpoint only if i equals 9!
We may also disable stopping on a breakpoint if we do not want to remove it, but also do not want a debugger to stop on it.
If we uncheck the “Suspend” checkbox, then we will have even more options to choose from.
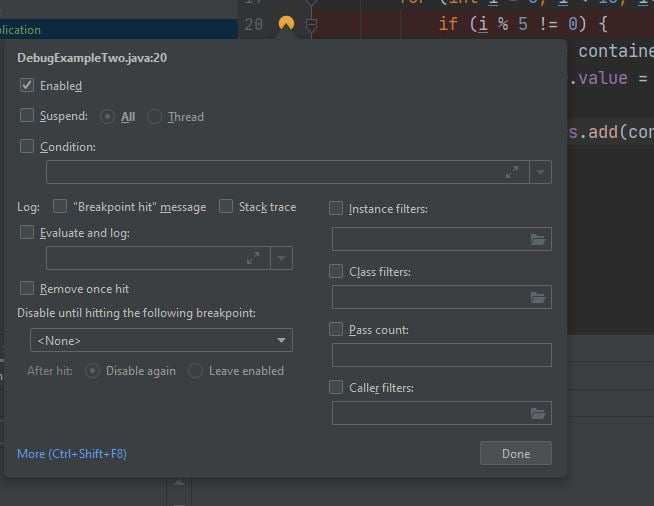
We have the option to log the message that breakpoint was hit (Log “breakpoint hit” message) or full stack trace (Log stack trace). There is an option to evaluate an expression and log this instead (Evaluate and log). A breakpoint may be removed, once it’s hit (Remove once hit). There are also several filters and a pass count.
If you want to know more about breakpoints advanced options, see official reference
Throwing exception
It is possible to throw an exception for a particular frame during debugging. This may come handy in case we want, for example, test how code behaves when it is thrown, or if we do not want to reproduce the error.
To do that, we can pick a frame that we want to throw an exception in, and right-click on it:
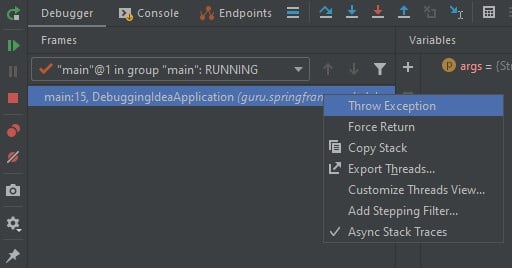
Next, a window will appear allowing us to specify an exception to throw:
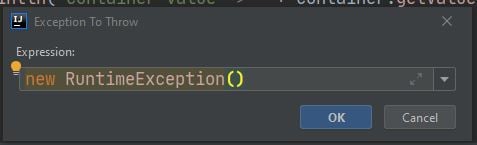
After clicking OK button, the exception will be thrown and we can use it in further debugging.
Changing variable value
During the debugging session, it is possible to alter the values of variables and object properties. It may be useful if we want to test methods using values that may be hard to generate with the most usual run path.
In the second example above, we have used a loop that we will use to show how to change variable value.
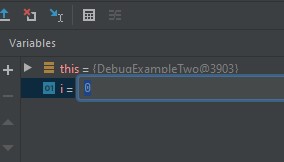
If we set a breakpoint on the line with the modulo condition, we will have i variable in watches. If we click on that watch with right-click and select set value we will be able to alter the value of that variable:
Try to change that to 6 and as a result of the program we will have such output:
Reloading of modified classes
There is a possibility to reload classes that were modified during debugging. It is useful if want to test your changes immediately, without restarting the debugging session. For more information on this, see official reference
Summary
In this tutorial, we have learned how to use IDEA debugging tools. We have seen a broad range of tools that can be used during debugging, to help the programmer with this, often daunting, process. With the use of such features as breakpoints, stepping, frame and variables modifications we can help ourselves a lot on that bug hunting quest.
For a more detailed description of debugging tools, please see the official GitHub.